|
You are here: MIT OpenLabWare » Optical Trapping
» Module Overview
Module Overview
The Principles of the Optical Tweezers
An optical tweezer is a device that uses a focused laser beam to
capture
dielectric particles on a microscope slide. This device can trap
various biological specimens such as bacteria, viruses, and proteins. By
manipulating these specimens one can understand the molecular forces involved
in their functioning. For example, a kinesin motor protein can be trapped and
manipulated to calculate the forces it exerts as it moves through the
cytoskeleton.
To manipulate a particular biological
molecule, one can attach it to a
microscopic bead and then trap the bead with a focused laser. The molecule,
such as a motor protein, may move and apply a force to the trapped bead. Based
on the displacement of the bead and on the stiffness of the laser trap, one
can measure the force exerted on the bead. The forces involved in a trap
system are like the forces involved in a spring. Hooke's law states
that:
F = -kx
In the above equation, F is the force, k is the trap stiffness (analogous to a
spring constant), and x is the displacement of the bead. The displacement of
the bead can be measured very accurately with position detection equipment
that is part of the optical trap system. The value of k needs to be calibrated
before measuring these other parameters. One way to calibrate the trap
stiffness, k, is with the Equipartition Theorem, which will be briefly
discussed in the Optimal Modulation Frequency section. The force exerted on
the bead will be the force that is involved in the functioning of the molecule
in question.
So how does an optical trap actually capture the material in question? The
trapping mechanism makes use of the small forces that light can exert on an
object--forces that result from electric field gradients and
photon momentum changes. An
optical trap focuses a light beam on a specific material--a cell, virus, or
bead--that has a higher refractive index than its surrounding medium.
This focused light can be described with a series of rays, with most rays
traveling at the center of the beam where the light is most intense. Because
the target has a higher refractive index than the medium surrounding it, the
light passing through it will bend inwards and undergo a change in momentum
(See Image 1). The object undergoes an equal and opposite change in momentum
(remember Newton's Third Law?). The more intense light
coming from the center of the beam
bends away from the center. This refraction creates a force
towards the
center of the beam. The less intense light creates a force away from the
center, but this force is weaker than the one created by the
intense light. Therefore, the net
force, known as the refractive force, on the bead makes it
move to the center. If the object had a lower refractive index than that of
its medium, it would experience a force in the outward direction and would
instead be pushed out of the beam. If the refractive indexes were the same,
the light would pass through the object and have no effect.
The change in momentum of the photons also causes a force in the direction of
light propagation. This force is known as the scattering force, and it
drives the material away from the center of the trap. Therefore, a stable trap
requires that the refractive force
exceed the scattering force. To meet this requirement, one must create a tight
focus at the center of the trap, meaning that most light rays should be
traveling down the center of the beam.
This will create a strong refractive force that pushes the bead to the center
of the optical trap. To create this gradient, the trapping laser must be
highly focused with an objective lens that has high numerical aperture
(NA). See Image 2 for a representation of the optical trap system.
Image 1. (Modified from Block, J. Making light work with optical
tweezers. Nature. 36. 493-495 (1992).) This is an illustration of the
light rays hitting a bead. The dark dashed and solid lines represent the light
rays. The solid line is the brighter light ray coming from the center of the
beam. The dashed line is a dimmer ray coming from the edges. The gray lines
represent the forces created by the change in light momentum. Because of the
light gradient, the force pulling the bead towards the center of the beam is
stronger than the force pulling the bead away.
Image 2. This is an illustration of the bead in the optical trap system. The
bead is pulled in the direction of light propagation by the "scattering"
force. The refractive force pulls it towards the center of the beam. The term
beam waist refers to the narrowest point of the laser beam.
The Principles of Fluorescence Spectroscopy
Fluorescence spectroscopy presents another method of studying the behavior of
molecules. When light hits a molecule, the molecule becomes "excited," meaning
that its electrons absorb energy and climb to higher energy states. When the
molecule loses energy, the electrons go back down to lower energy states.
This process--when the molecule emits energy in the form of light--is called fluorescence.
The energy of a photon of light is proportional to its frequency, as
shown by the equation:
E = hν
E represents the energy of the photon, h represents Planck's constant,
and ν represents its frequency. Through the
technique of fluorescence spectroscopy one can measure the various frequencies
of the photons that a molecule emits. With these measurements one can thus
calculate the various photon energies and determine the molecule's
structure.
For a more detailed explanation of fluorescence, follow the tutorial
given at:
http://probes.invitrogen.com/resources/education.
Fluorescence can be very useful for biological applications. For example, one
can study how an enzyme reacts with a protein by labeling a portion of the
protein with a fluorescent dye. The enzyme may cleave the protein at a
specific point, and one may determine where the protein was cleaved relative
to the location of the dye. The uses of fluorescence labeling are not limited
to proteins; the structures of various biological organisms can be determined
thanks to fluorescent dyes.
The Lang Group Project
Overview
If one can study a molecule with optical tweezers and with fluorescence, one
may be able to understand both the biochemical configuration of a molecule and
the forces applied in the various functions of that molecule. For example, one
may be able to measure not only the forces that a motor protein exerts, but
also the changes in configuration that it undergoes. To use the two techniques
simultaneously, however, the Lang group needed to overcome a problem called
photobleaching: fluorescent dyes, when exposed to light, eventually
lose their fluorescence. The more intense the light, the faster photobleaching
occurs. They decided to focus their studies on a fluorescent dye called Cy3.
They chose Cy3 because it is a commonly used dye, and its combination with
optical tweezer technology can be useful for many applications. They needed to
figure out how to expose the material in question (which would have Cy3
attached to it) to both a trapping laser and to a fluorescence excitation
laser. The trapping laser would keep the object in place, and the excitation
laser would cause the dye to fluoresce.
Their main question was: How does one design an optical trap system so that
optical tweezer force spectroscopy and single molecule fluorescence
spectroscopy techniques can be used simultaneously? To tackle this question,
they hypothesized that the
photobleaching effect could be reduced by alternately switching the trapping
laser and the excitation laser. They designed the project in three parts:
-
First, they needed to figure out what would be the ideal modulation
frequency at which to operate the trapping laser.
-
Then, they needed to evaluate the effects that the trapping laser would
have on Cy3.
-
Finally, they needed to make a measurement using fluorescence and an
optical tweezer to make sure that such a combined arrangement can
work.
Ultimately, they devised a method called Interlaced Optical Force-Fluorescence
(IOFF). In this technique, the object in question is alternatively exposed to
a trapping laser (to hold the bead in place) and an excitation laser (to make
the dye fluoresce).
Step 1: Finding an Optimal Modulation Frequency
Lang and coworkers first had to find the right frequency at which they could
operate their trapping laser. As you will see, they conducted various
experiments where they placed a bead in the optical trap. They measured the
bead's displacement from the center of the trap as a function of time
at
various laser frequencies. They found that variance in position decreases as
the frequency increases (Figure 1A). Such an observation makes sense because
at higher frequencies the bead comes in contact with the beam more often and
has less time to diffuse away from the center.
To further quantify these observations, Lang and coworkers measured the
stiffness of the trap as a function of frequency and power. The trap stiffness
was measured using the following equation based on the Equipartition
Theorem:
kbT=kx<x2>
For more on the Equipartition Theorem, visit:
http://en.wikipedia.org/wiki/Equipartition_theorem.
What's important to know is that the strength of the trap, its
"stiffness",
can be measured just by knowing the mean-squared displacement of the bead,
<x2>, or how much it moves in a given time period. The term
kb is Boltzmann's constant, and T is the temperature of
the
system.
Knowing the displacement of the bead, one can measure the stiffness of the
trap, kx. The Lang group found that stiffness increases with power
and frequency (Figure 1B). Again, these results are reasonable because one
would expect that a laser with higher power or one that is being modulated (or
switched) at higher frequencies will hold a bead more strongly than a beam at
lower power or lower frequency. They found that stiffness as a function of
frequency forms an S curve that eventually plateaus at a maximum stiffness
value (Figure 1B). Therefore, there is a maximum frequency value after which
the stiffness will no longer increase regardless of how high the frequency
becomes. Increasing the power of the laser increases the
maximum stiffness value that you can reach.
Take a look at the experiments under the Optimal Modulation Frequency
Preliminary Experiments section to see the preliminary work that led to
their final results.
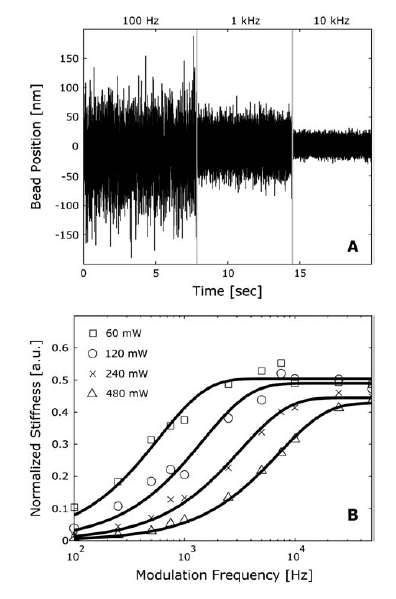
Figure 1. (A) This graph shows that bead position varies less with increasing
modulation frequency. (B) The stiffness of the trap increases with both
modulation frequency and with power.
Step 2: Evaluating Fluorophore Longevity
The next step in their project was to determine the effects that their
trapping laser would have on the dye Cy3. Preliminary experiments tested
various other dyes by first exposing them to fluorescence excitation lasers
and then to a trapping laser. The common observation was that the dye in
question would decay gradually under exposure to the excitation laser and then
would decay very rapidly (photobleach) when it was exposed to the trapping
laser. The Lang group performed such experiments on the Cy3 dye, and they also
tested the effects that different arrangements of excitation and trapping
lasers would have on Cy3. The group exposed the dye to the following 3
conditions:
- Cy3 exposed to an excitation laser alone.
- Cy3 exposed to excitation and trapping lasers that are out of phase with
each other. In the out of phase condition, the dye is never exposed to both
lasers at the same time.
- Cy3 exposed to excitation and trapping lasers that are in phase with each
other. In this condition the dye is exposed to both lasers at the same time.
To expose Cy3 to the lasers, the Lang group attached the molecule to a
DNA strand, called a DNA ladder, which was in turned bound to an
antibody that was bound to the microscope slide. Once the assay was
designed and troubleshooting was finished, they created 100 such arrangements
for each of the three conditions mentioned above. Collecting
this data took two full work weeks to
complete. The fluorescence excitation laser was modulated at 50 kHz with a 30%
duty cycle, and the trapping one was modulated at 50 kHz with a 50%
duty cycle. In their first graph, Figure 2A, they show that Cy3 experiences a
sharp decay in fluorescence immediately after being exposed to the trapping
laser. In Figures 2B, 2C, and 2D, they present histograms of the fluorescent
counts of individual Cy3 molecules under the various conditions. Each bar
represents the fraction of molecules that fluoresced for a given amount of
time. For example, looking at Figure 2B, one can see that a fraction of
(1/2.73), or about 30 molecules out of the total of 100, fluoresced for a
period between 0 and 30 seconds. With that data they can determine a decay
constant, which serves as a measure for the amount of time that a dye molecule
will fluoresce. For the condition in which there was no trapping laser (Figure
2B) the decay constant was approximately 90 seconds. When the trapping and
excitation lasers were out of phase (Figure 2C) the decay constant was about
30 seconds. When they were in phase (Figure 2D), the decay constant was just
over 1 second. As one can see, the out of phase condition is preferable to the
in phase condition because under that condition the Cy3 dye lasts much longer
and can be used for fluorescence studies.
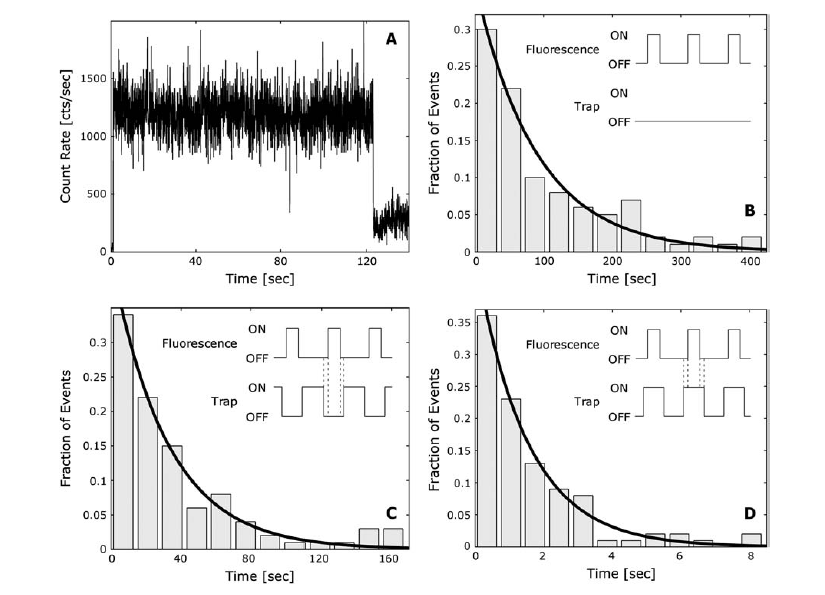
Figure 2. (A) The fluorescence of Cy3 drops immediately after the dye is
exposed to the trapping laser. (B) Under only the fluorescence laser, the Cy3
dye has a decay constant of about 90 seconds (C) Under out of phase
conditions, the decay constant is 30 seconds. (D) Under in phase conditions,
the Cy3 decays after just 1 second.
Step 3: Making a Simultaneous Optical Trap and Fluorescence Measurement
The final step was to show that one can actually make a fluorescence and
optical trap force measurement simultaneously. The setup of the combined
measurement experiment is shown in Figure 3A. A long double stranded DNA
strand is bound to a bead with biotin. One strand of this DNA is longer
than the other and is bound to the Cy3 dye. A smaller DNA strand complements
this overhang and is attached to the microscope slide with an antibody. The
bead is exposed to out of phase excitation and trapping lasers and is thus
trapped. The microscope slide is pulled at a constant velocity while the bead
remains trapped. This motion exerts a force on the DNA, as shown by the sharp
force increase in the top line of Figure 3C. Once the DNA strand breaks, the
bead is no longer being pulled by the slide, and the force on it drops back to
0 picoNewtons (pN). At the same time, the Cy3 is moved out of the excitation
laser's path, thus making the fluorescence drop to background levels
once
again.
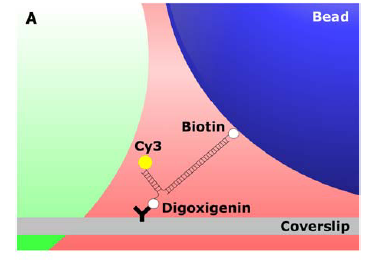
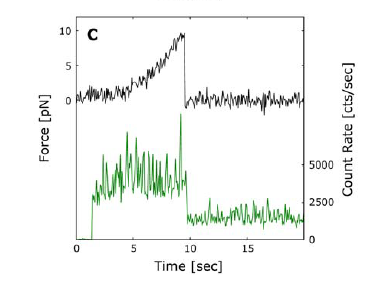
Figure 3. (A) The layout of the combined measurement experiment. (B) See the
Lang group paper. (C) Simultaneous measurement of Cy3 fluorescence and of the
force applied to the DNA strand.
Equipment Overview
As you can imagine, moving tiny structures around with light requires a lot of specialized equipment. This section
is designed to introduce you to the apparatus used. Click
here for a video overview.
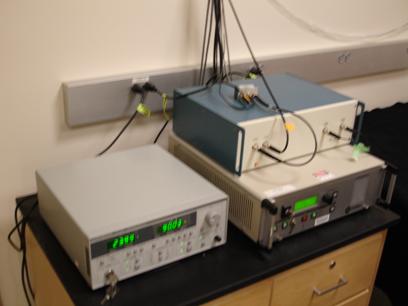
Photo 1. Power supply and controls for various
components of the optical trap.
The left box is for the detection laser, the bottom right one is for the trapping laser, and the top right one is
for the Acoustic Optical Deflector (AOD). This equipment is outside the room that contains the optics material
because it is too noisy and could disrupt measurements.
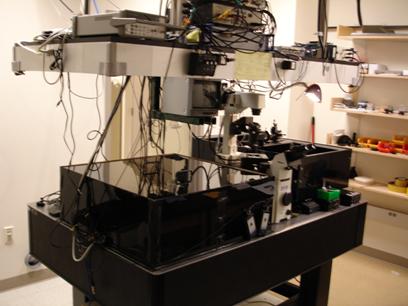
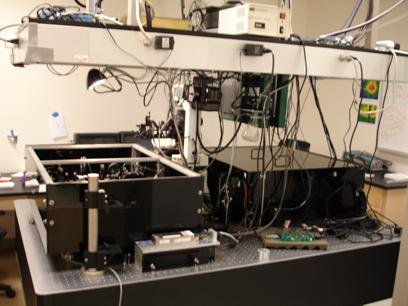
Photo 2: All the equipment used in the optical trap. The
completely dark box
contains devices used for fluorescence detection. The equipment needs to be in the dark when in use because the
sensors and cameras are very sensitive to light. The open box contains the optical equipment that expands and
aligns/steers the various lasers (position detection, fluorescence, and trapping) used in the trap. All the
equipment is on a floating optical table that minimizes vibrations from the building. The room is located in the
basement of the building because the basement suffers fewer vibrations than the higher floors.
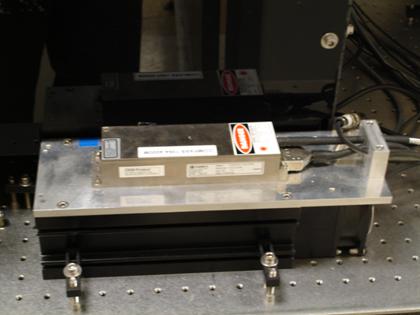
Photo 3: The laser head, or source, of the
trapping laser. The trapping laser is
directed, via mirrors, into the box with all the optics equipment.
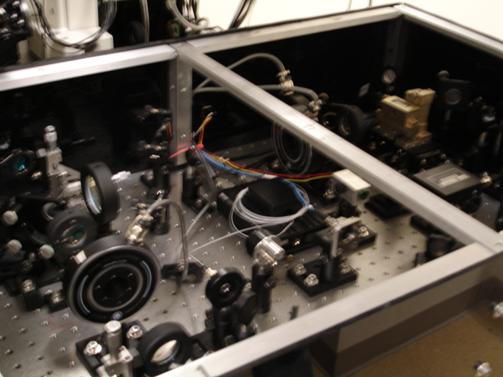
Photo 4: An overview of the optical trap
equipment. There are various mirrors and
filters that are used to both expand and align the laser beams. The laser beams must be properly aligned because they
need to enter the objective lens vertically. Problems in alignment can lead to poor measurements.
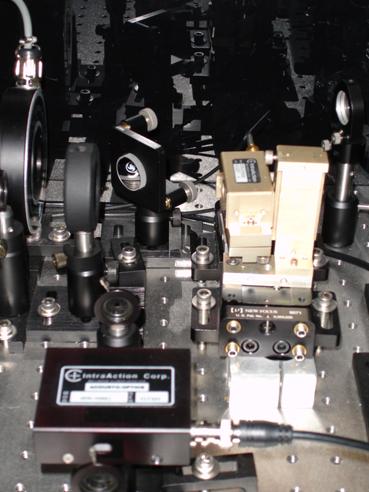
Photo 5: The two AODs in the system. The black
AOD is used to "chop,"
or alternatively turn on and off, the fluorescence laser, and the beige one is used to "chop" the trapping
laser.
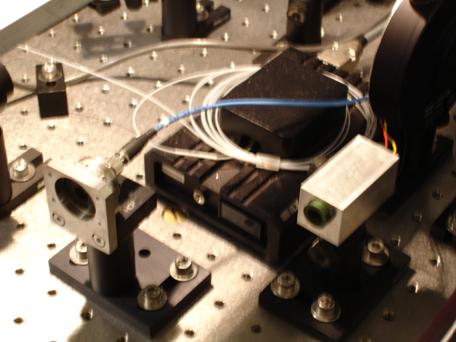
Photo 6: The laser heads for the fluorescence
lasers. The device attached to a
blue fiber cable is the source of a blue fluorescence laser, and the device to the right, attached to a red cable and
a yellow fiber cable, is the source for a green laser. The use of laser depends on the dye that will fluoresce. For
Cy3, a green laser is used.
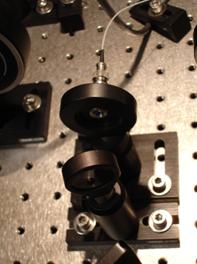
Photo 7: The detection laser fiber output.
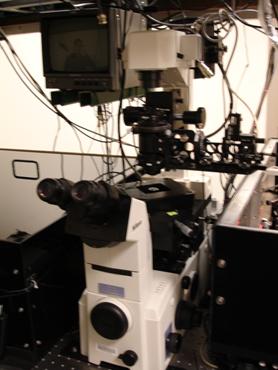
Photo 8: The inverted microscope used to
visualize an optical trap. In this
inverted microscope, the objective lens is below the specimen and the condenser lens is above it. The condenser lens
illuminates the specimen, and the objective one focuses the lasers on it. The objective lens also magnifies the sample
for imaging.
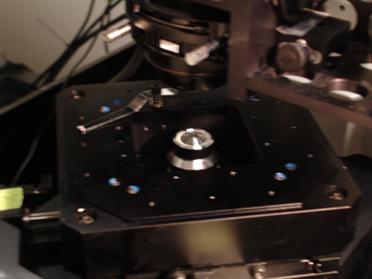
Photo 9: The objective lens and the piezoelectric
stage. The sample with the
object that is to be trapped is placed on top of the objective. The objective lens focuses lasers on the sample and
magnifies the sample. The piezoelectric stage can be moved very precisely providing nanometer level positioning. It is
often used to move the specimen away from the optical trap, thus exerting a force that can be measured based on the
specimen's displacement from the trap.
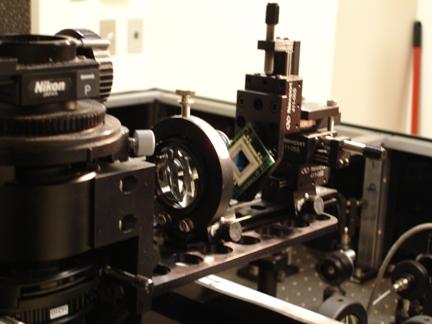
Photo 10: The equipment used for detecting the
position of the sample under
study. It manipulates the position detection laser that comes from the optics box. The detection laser is focused on
the green and blue chip, known as the Position Sensitive Device (PSD).
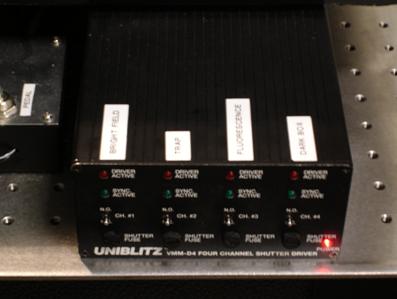
Photo 11: A controller for the shutters in the
optics box. There are shutters for
the detection laser, for the trapping laser, for the bright field illumination light, and for the fluorescence laser.
The shutters are used to block specific lasers from entering the objective when they are not needed.
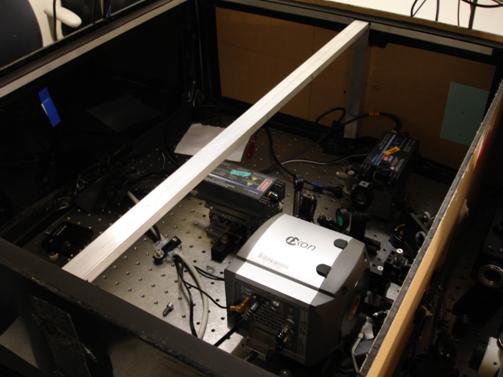
Photo 12: The dark box. It contains two Silicone
Avalanche Photo Diodes (SAPDs)
that detect fluorescent photons hitting their photosensitive chips, a camera that allows you to visualize the
fluorescence, and a CCD camera that allows you to visualize your specimen under bright field illumination. The CCD
camera is isolated on the right and connected to a monitor above. The image of the microscope sample is directed into
the camera and can be seen in the monitor. The camera is separated from the SAPDs and the fluorescent camera because
the light being directed into the camera must not illuminate the sensitive fluorescence detection devices. The SAPDs
are so sensitive that the light would damage their photosensitive chips.
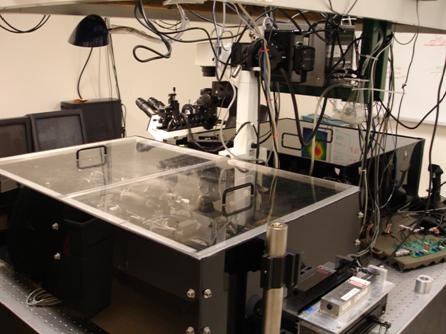
Photo 13: The optics box closed with clear
plastic covers. The optical equipment
is normally covered to protect it from dust and from any minor air drafts that may affect the equipment. The Lang
group has done studies to show that measurements taken without the lids in place are different than measurements taken
with the lids.
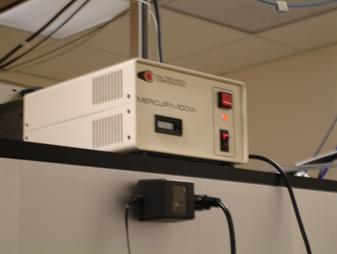
Photo 14: The power supply for the bright field
illumination light.
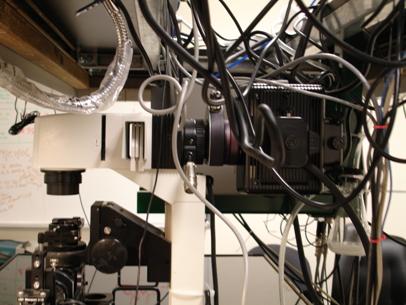
Photo 15: The source of bright field
illumination.
| 