| |
You are here: MIT OpenLabWare » Optical Trapping
» Read the Paper
Read the Paper
General Information
This is the HTML version of the paper. Click
here to see a
PDF
file of the paper as it was published in 2006. To view this article at the publisher's website, click here.
Publication Information
Biophys J.
Vol. 91, Iss. 3, pp. 1069-1077, August 2006
Interlaced Optical Force-Fluorescence Measurements for Single Molecule Biophysics
Abstract
Combining optical tweezers with single molecule fluorescence offers a powerful technique to study the biophysical properties of single proteins and molecules. However, such integration into a combined, coincident arrangement has been severely limited by the dramatic reduction in fluorescence longevity of common dyes under simultaneous exposure to trapping and fluorescence excitation beams. We present a novel approach to overcome this problem by alternately modulating the optical trap and excitation beams to prevent simultaneous exposure of the fluorescent dye. We demonstrate the dramatic reduction of trap-induced photobleaching effects on the common single molecule fluorescence dye Cy3, which is highly susceptible to this destructive pathway. The extension in characteristic fluorophore longevity, a 20-fold improvement when compared to simultaneous exposure to both beams, prolongs the fluorescence emission to several tens of seconds in a combined, coincident arrangement. Furthermore, we show that this scheme, interlaced optical force-fluorescence, does not compromise the trap stiffness or single molecule fluorescence sensitivity at sufficiently high modulation frequencies. Such improvement permits the simultaneous measurement of the mechanical state of a system with optical tweezers and the localization of molecular changes with single molecule fluorescence, as demonstrated by mechanically unzipping a 15-basepair DNA segment labeled with Cy3.
INTRODUCTION
Significant advances in single molecule techniques and their application to biological systems have provided new insight into the mechanistic behavior of single proteins and other biological molecules (1-3). Two such techniques, single molecule fluorescence spectroscopy and optical tweezers force spectroscopy, permit the direct observation of energetic heterogeneities and conformational differences within populations that may be otherwise lost in the inherent averaging of bulk measurements. Optical tweezers force spectroscopy yields quantitative information about the mechanical forces involved in interactions at the single molecule level (4), and single molecule fluorescence reports on binding interactions and provides insight into the structural and conformational states of proteins (5). Although these two experimental approaches independently provide different perspectives from which to approach biological problems, their combination results in a powerful tool for the analysis of molecular motors, protein-protein and protein-DNA interactions, biomolecular conformational changes, and mechanotransduction pathways (6-10). In this report, we describe a novel technique that dramatically improves both the practicality and versatility of such an arrangement by eliminating a dominant photobleaching pathway that results from the exposure of excited-state fluorophores to the high photon flux of optical tweezers (11). This technique, in which the trapping and fluorescence excitation beams are alternately modulated, allows for the seamless integration of optical trapping and single molecule fluorescence without compromising trap stiffness or fluorescence sensitivity.
Optical tweezers force spectroscopy has been widely adopted for exploration of the effects of mechanical forces on single molecule systems (4). The high force and position sensitivity that facilitates such measurements, typically on the order of piconewtons and nanometers, respectively, is achieved by trapping and manipulating a dielectric particle within a tightly focused laser beam. In most instances, the trapped particle is tethered in close proximity to a biological specimen and can be used to noninvasively measure the mechanics of single molecules and their binding interactions (12-16). In addition, optical tweezers have found particular applicability for studying the mechanical properties of molecular motors, such as kinesin, myosin, RNA polymerase, and others (17-20).
Although optical tweezers force experiments are critical to understanding the molecular underpinnings of a variety of biological processes, the combination of this technique with single molecule fluorescence spectroscopy further extends its versatility. By incorporating direct reporting through a fluorescent label, single molecule fluorescence provides an added observable dimension that allows the examination of the localized effects of applied forces on the system of interest (7,9). However, despite technological advances that have made single molecule fluorescence more accessible (21), a practical approach for its integration with optical tweezers has remained elusive due to the destructive photobleaching effects that are caused by the trapping beam (8,11).
Several approaches pioneered the development of instruments that simultaneously combine these two techniques. For example, dual-beam optical trap configurations have been employed to separately study the motility of Cy3-labeled RNA polymerase along double-stranded DNA (dsDNA) and the mechanochemical interactions between myosin and actin filaments (22,23). These assay geometry arrangements require either filamentous proteins or dsDNA to be suspended between the two independent optical traps, limiting its adoption for experimental systems demanding coincident trapping and fluorescence. Such a design was later demonstrated using an efficient optical trap configuration in combination with objective-side fluorescence illumination, high-performance optical filters, and a judicious choice of a fluorescent marker that is not heavily susceptible to trapinduced photobleaching (8,24). This apparatus, which used fluorescence to confirm the mechanical unzipping and shearing of tetramethyl rhodamine (TMR)-labeled dsDNA, incorporates a fluorescence excitation laser and single molecule fluorescence detection equipment that can be easily interfaced with optical tweezers instrumentation. Unfortunately, neither method directly addresses the recently quantified phenomenon of trap-induced photobleaching, a process to which TMR exhibits very little susceptibility. However, it is not a popular single molecule dye because of its relatively low quantum yield and extinction coefficient and because its conjugation to proteins can lead to a considerable loss of fluorescence (25). Even if these limitations could be generally overcome at the single molecule level, complicated experimental schemes involving multiple fluorophores will necessarily employ dyes other than TMR.
Current approaches are impractical with popular single molecule dyes, such as Cy3, because their fluorescence longevity is severely reduced by over an order of magnitude when employed in a combined, coincident arrangement (11). In this report, we present a temporally based solution that extends the longevity of such fluorophores in the presence of a high-intensity optical trap by alternately modulating the trapping and fluorescence excitation beams. This technique, which we term interlaced optical force-fluorescence (IOFF), requires only minor modification of conventional optical tweezers arrangements and does not compromise trap integrity. We further demonstrate the effectiveness of this approach using Cy3, a commonly employed single molecule dye that is highly susceptible to trap-dependent photobleaching (11), to show dramatic improvement in single molecule fluorophore longevity in the presence of a trapping laser. Cy3 is an exceptionally bright dye, and, to our knowledge, this is the first instance in which Cy3 has been used in a combined, coincident optical tweezers and single molecule fluorescence arrangement. Furthermore, we effectively combine the two techniques for the mechanical unzipping of a Cy3-labeled 15-bp dsDNA. This model system confirms the nominal effects of laser modulation on trap stiffness and represents a significant step in extending the versatility of IOFF. Such a technique may be applicable to a range of fluorophores and molecular geometries and opens the possibility for the exploration of more advanced systems, such as real-time binding kinetics or energy transfer mechanisms.
MATERIALS AND METHODS
Instrument design
The combined optical tweezers and single molecule fluorescence instrument (Fig. 1) is based on a heavily modified inverted microscope (Nikon, Melville, NY) and is similar to previously proven arrangements (24,26). This device combines separate lasers for optical trapping (1064 nm; Coherent, Santa Clara, CA), position detection (975 nm; Coming Lasertron, Bedford, MA), and fluorescence excitation (532 nm: World Star Tech, Toronto, ON) through a base that has improved mechanical stability, incorporated Nomarski optics, and a piezoelectric stage (Physik Instrumente, Auburn, MA). In addition, the arrangement includes a pair of computercontrolled acousto-optic deflectors (AODs; IntraAction, Bellwood, IL), which permit precise steering of the trapping beam in two dimensions, and remote-controlled flipper mirrors and shutters, which facilitate rapid switching between bright-field imaging (CCD camera; DAGE-MTI, Michigan City, IN) and high-sensitivity fluorescence detectors.
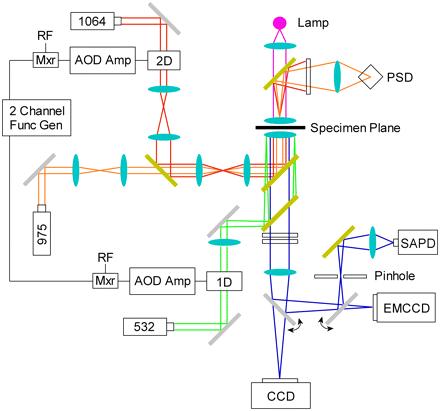
FIGURE 1 Optical layout of the instrument. All lenses, including the objective and condenser, are displayed as light-blue ovals. Filters, mirrors, and dichroics are represented as white, silver, and gold-filled rectangles, respectively. Trapping (red) and detection (orange) lasers, 1064 and 975 nm, respectively, are guided into the objective and focused on the specimen plane to form an optical trap. The position of the trapped particle is monitored by spectrally isolating and imaging the detection laser on a PSD. Total internal fluorescence excitation, supplied by a 532-nm laser (green), is focused near the back pupil of the objective. Bright-field illumination is provided by a mercury are lamp (magenta), and images (blue) are collected by a CCD camera. Fluorescence images (blue) are collected by an electron multiplying CCD (EMCCD), and single molecule fluorescence counts are spatially filtered through a pinhole and acquired by an SAPD. The trapping and excitation lasers are modulated by AODs controlled with an electronic mixer (Mxr) that combines a preamplified radio frequency AOD drive signal with a square wave generated in a function generator.
Both the trapping and detection lasers are guided into the microscope objective (100×, 1.40 numerical aperture, oil infrared; Nikon, Melville. NY) via a dichroic mirror (Chroma Technology, Rockingham, VT) that reflects only near-infrared light. The diameter of the trapping laser beam is adjusted with a telescope to slightly overfill the objective pupil to ensure high-efficiency trapping. After passing through the microscope condenser lens, the detection beam is spectrally isolated (Andover, Salem, NH) from the trapping beam and imaged on a position-sensitive device (PSD; Pacific Silicon, Westlake Village, CA) for back focal plane detection (27,28). This optical tweezers arrangement was calibrated using previously described procedures (4,26) and was found to be capable of trapping 500-nm-radius polystyrene beads with a stiffness of ~0.1 pN/nm per 100 mW of unmodulated trapping laser power.
In addition to these force capabilities, the microscope is outfitted for objective-side total internal reflection fluorescence excitation and single-molecule emission detection. The excitation laser, which is controlled by an independent AOD (IntraAction), is guided through a customized optomechanical system that replaces the microscope's fluorescence turret. This modification, which allows for focusing and off-axis translation of the excitation laser along the back focal plane of the objective, is set directly below the trap-steering dichroic mirror. It consists of a filter cube (532-nm dichroic and 540-nm long-pass filter; Chroma Technology) and a KG5 filter (Schott Glass, Elmsford, NY) to reflect the excitation light into the sample, transmit fluorescence emission, and efficiently block scattered or reflected light from the excitation, trapping, and detection lasers. Transmitted fluorescence signals are imaged with either an EMCCD intensified camera (Andor Technology, South Windsor, CT) or a photon-counting silicon avalanche photodiode (SAPD; PerkinElmer, Wellesley, MA), which collects through a pinhole (ThorLabs, Newton, NJ) conjugate with the specimen plane for the spatial signal isolation from background and bead scattering signals and a 628-nm dichroic mirror (Chroma Technology) for similar spectral separation.
To quickly modulate the intensities of both the trapping and excitation lasers, electronic mixers (Mini-Circuits, Brooklyn, NY) multiply both preamplification AOD radio frequency signals with a square wave signal from a two-channel function generator (Tektronix, Richardson, TX). This technique is similar to a recently demonstrated fluorescence sorting method (29) and to other trap modulation schemes (27,30). In essence, it temporally turns the trapping and excitation lasers on or off. allowing for their in-phase (IP) or out-of-phase (OP) synchronization. For all the experiments described in this report, the fluorescence excitation and trapping lasers were further modulated with a duty cycle of 30% and 50% and set to an average postmodulated power of 250 μW and 100 mW, respectively. In the OP condition, the pulses of the trapping and excitation lasers are aligned such that there is a 2-μs dark period in between pulses, as verified by a single photodiode (ThorLabs). The duration of the fluorescence excitation and trapping laser pulses are 10 and 6 μsec, respectively. For the IP condition, the phase of the trapping laser was shifted by 180°. placing the fluorescence excitation pulse squarely in the middle of the trapping laser pulse (see Fig. 3, insets). Custom software (LabView; National Instruments. Austin, TX) acquired all signals through a 16-bit A/D board (National Instruments) and automated all instrument components.
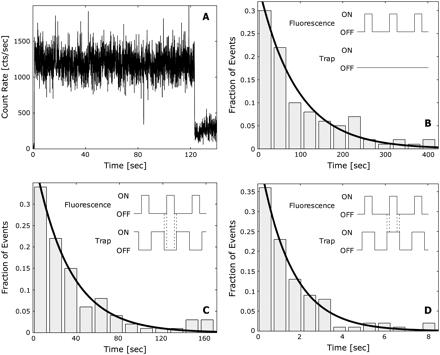 FIGURE 3 Cy3 single molecule fluorescence. (A) Example trace for a single Cy3 photobleaching event exposed to OP trapping and excitation radiation. The fluorophore emits light at a constant rate before irreversibly bleaching in a single step and returning the signal to background level. This particular Cy3 molecule had a longevity of ~120 s. Histograms (n = 100) of the longevities of single Cy3 fluorophores exposed to the (B) no trap (NT), (C) OP, and (D) IP modulation conditions. The data for each condition were fitted to a single exponential decay model with time constants of 89.87 ± 13.05 s, 1.49 ± 0.10 s, and 32.03 ± 5.72 s, respectively. All fits resulted in R2 > 0.95. Insets contain schematics of the modulation scheme employed for each condition. The hatch marks on the (C) OP and (D) IP insets mark the 2-μs offset between the trapping and fluorescence excitation laser pulses for each condition. Both trapping and excitation lasers were modulated at 50 kHz with a duty cycle of 50% and 30%, respectively.
Single molecule fluorescence
Flow cells were prepared as previously described (31). To prepare single molecule samples, flow cells were filled with 20 μM antidigoxigenin polyclonal antibody (Roche Applied Science, Indianapolis, IN), incubated for 30 min, and washed with 200 μL of Tris buffer (20 mM Tris, pH 7.5, 6 mM NaCl. 1.7 mM MgCl2, and 10% glycerol). They were then filled with 40 μL of 25 pM fluorescent DNA complexes (Operon Biotechnologies, Huntsville, AL) (oligo 1, 5'-Cy3-CCACTCTAGG-Dig-3': oligo 2. 5'-CCTAGAGTGG-Biotin-3'), which were annealed in TE buffer (pH 8.0; Integrated DNA Technologies, Coralville, IA) and designed to be similar to those used in other single molecule fluorescence studies (32). After a 15-min incubation, unbound complexes were washed with 200 μL of fluorescence buffer (Tris buffer. 120 nM catalase (Calbiochem. San Diego, CA), 25 mM β-D(+) glucose (Calbiochem). 1.8 μM glucose oxidase (Calbiochem), 1% β-mercapto-ethanol (VWR, West Chester, PA), degassed for 30 min in a dessicator). All incubations took place in a humidity chamber at room temperature.
Single, immobilized Cy3-labeled molecules were visualized on the EMCCD camera for ~ 1 s, and isolated fluorophores were chosen and, using the piezo stage, repositioned for pinhole imaging on the SAPD. Fluorescence was collected until a discrete single bleaching step was observed to return count levels to background. After photobleaching, the signal was monitored for at least 30 s to ensure that the fluorophore did not undergo an intermediate dark state electronic transition as observed in some samples. Even though a similar blinking behavior has been previously described (33), we were careful to exclude them from the analysis because they would introduce unacceptable ambiguity in experiments employing combined, coincident optical tweezers and single molecule fluorescence. All signals were acquired at 20 Hz and were analyzed using MATLAB (The MathWorks. Natick, MA).
dsDNA unzipping assay preparation
The dsDNA unzipping assay was prepared as described previously with minor modifications (24). These include using Cy3 as a fluorescence reporter and replacing the final wash step with 200 μL of fluorescence buffer containing 0.15 mg/mL bovine serum albumin. Once identified, tethers were precisely located to the pinhole collection zone using the position sensing system in the instrument device. This assay provides a convenient system in which to use Cy3 in a combined, coincident optical tweezers and single molecule fluorescence arrangement.
RESULTS
Optimal modulation frequency
When trapped with a modulated laser, the thermally driven motion of a bead is determined by the properties of the focused trapping beam and the bead itself. It is also affected by the frequency and duty cycle at which the trapping laser is modulated, suggesting that the principal effect of modulation is to alter the stiffness of a trap at a given power. These effects have been previously explored for the stable trapping of multiple particles with a single time-shared trap (27) or with holographic optical tweezers (34). Here, we further explore these effects on the force-exerting capabilities of the trap to determine optimal modulation conditions.
Thermal effects become apparent when the position of a trapped bead is monitored as a function of time for different modulation frequencies (Fig. 2 A). At low frequencies, the trapped bead is allowed to diffuse through a large volume of space, whereas at higher frequencies, the trap constrains its motion to a reduced space. To quantify the effect of modulation on the optical tweezers capabilities, the stiffness of the trap was monitored as a function of modulation frequency for different trapping powers. Trap stiffness, kx, was measured using the equipartition theorem to relate the mean-squared displacement of a trapped bead, <(x2)>, to the thermal energy in the system, kbT, such that kx<(x2)>/2 = kbT/2.
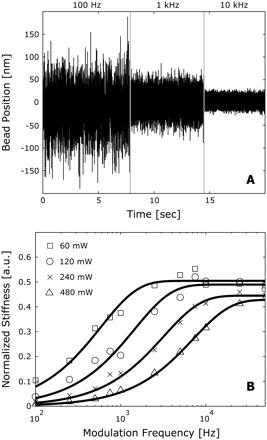 FIGURE 2 Effect of modulation on the integrity of an optical trap. (A) Position trace of a trapped bead for a 50% duty cycle with 100-Hz, 1-kHz. and 10-kHz modulation frequencies. The space explored by the bead is reduced as the modulation frequency increases. (B) Effect of modulation on the stiffness of an optical trap for 60 ([white square]). 120 ([white circle]), 240 (×), and 480 ([white triangle up]) mW of trapping laser power. For each power, the measured stiffness was normalized by the trap stiffness of a continuous trap. The data were fit to a simple exponential function, resulting in characteristic modulation frequencies of 0.59, 1.5, 3.2, and 7.1 kHz, respectively.
For a set of modulation frequencies ranging from 100 Hz to 50 kHz, the stiffness of the trap increased monotonically with frequency under constant laser trap power and modulation duty cycle. A similar behavior was also observed when the stiffness of the trap was determined with the Stokes drag and power spectrum calibration methods (results not shown). For each trapping power, the modulated stiffness values were normalized by the measured stiffness for an unmodulated trap (Fig. 2 B). The resulting trends resemble an S-curve and are well described with an exponential function of the form y = A(1 - exp(-f/fm)), where A is the maximum achievable stiffness, f the modulation frequency, and fm represents a characteristic modulation frequency for the system. As expected, all fits converge near 0.5 at high modulation frequencies (>10 kHz) with a 50% duty cycle. For trapping powers of 60, 120, 240, and 480 mW, the curves are described by characteristic modulation frequencies of 0.59, 1.5, 3.2, and 7.1 kHz, respectively. These values, which have a linear dependence on average trapping power (R2 > 0.99), correspond to the modulation frequencies at which the trap stiffness is 63% of the maximum stiffness for a modulated trap. Therefore, for a given power, a trap must be modulated at a frequency that is higher than its characteristic frequency of modulation. For example, if it is modulated at a frequency five times greater than its fm, the resulting trap will be characterized with a stiffness that is 99% of that of a continuous trap formed with the same average power.
In addition to the relationship between the characteristic modulation frequency and trap power, the fits produce a fm that is ~15% less than the corner frequency of an unmodulated trap at all powers studied. The coiner, or roll-off frequency, fc, describes the motion of a trapped bead and is determined by fitting the power spectral density of bead position to a Lorentzian function (4). This close dependence suggests that, for a given power, the corner frequency of an unmodulated trap can serve as a guideline to determine the minimum modulation frequency at which it resembles a continuous trap. Alternatively, modulation should occur at the highest frequency possible.
Fluorophore longevity
Bulk fluorophore decay rates were found to be independent of modulation frequency: however, they were found to be dependent on the modulation duty cycle and average excitation laser power (results not shown). For these reasons, the fluorescence excitation laser was modulated at 50 kHz with a 30% duty cycle and set to deliver an average power of 250 μW, whereas the trapping laser was modulated at 50 kHz with a 50% duty cycle and delivered an average power of 100 mW. These conditions permit the IP or OP synchronization of the trapping and excitation lasers while maintaining the highest possible trap stiffness, reducing the fluorophore photobleaching caused by the excitation laser, allowing good single fluorophore emission sensitivity, and keeping the trapping and excitation laser fluxes constant throughout all experiments. A third condition, in which fluorophores were exposed to the modulated excitation laser with no trapping laser (NT), was used as a control to establish the normal decay profile of the fluorophores. These schemes rely on the separation of time scales between the nanosecond relaxation time constant of excited electrons, the microsecond pulses of our modulation scheme, and the inherent millisecond averaging of the data acquisition rate.
Single Cy3 molcules, which were immobilized on glass coverslips through short DNA linkers to prevent interaction between the fluorophore and substrate, were simultaneously exposed to modulated fluorescence excitation and optical trap lasers to quantify trap-dependent photobleaching effects. The single dyes fluoresced at a constant level before instantaneously bleaching in a single step, returning the signal to background (Fig. 3 A). For each condition, the fluorescence emission longevity of 100 Cy3 dyes was recorded, and histograms were fitted to a single exponential decay model to extract a characteristic decay constant for each condition (Figs. 3, B-D) (35,36). Cy3 fluorophores irradiated in the NT condition were found to have a decay constant of 89.87 ± 13.05 s, whereas those exposed to the IP and OP arrangements had decay constants of 1.49 ± 0.10 and 32.03 ± 5.72 s, respectively. Clearly, the OP configuration represents a dramatic improvement in the longevity of Cy3 fluorophores over IP. In addition, this modulation condition creates enough time before photobleaching for the low loading rate measurement of mechanical events with an IOFF arrangement.
Combined measurement
To demonstrate the suitability of our approach, we applied the OP synchronization of the trapping and fluorescence excitation lasers to the unzipping of a 15-bp region in a simple dsDNA system (Fig. 4A). The modulation and power settings for both lasers were kept as described above. Cy3 emission was used to confirm mechanical events occurring in response to the application of external mechanical loads. In this case, upon dsDNA unzipping, the fluorescence emission was reduced to background levels simultaneously with the mechanical break, confirming that the dsDNA was unzipped (Fig. 4 C). The force required to unzip the 15-bp dsDNA region, ~10 pN, is consistent with control experiments (Fig. 4 B) and with other similar systems (8,24.37). To our knowledge, this is the first instance in which Cy3 has been used in a combined, coincident single molecule fluorescence and optical tweezers mechanical measurement. As a control, Cy3 was irradiated with the OP arrangement until irreversibly photobleaching, which occurred at -45 s (Fig. 4 B). No force was exerted on the dsDNA system during this period, but after photobleaching, the tether was loaded at 100 nm/s until rupture was observed at -10 pN (Fig. 4 B). As expected, the fluorophore emitted at a constant level and was not disturbed by the presence of the trap. However, when compared to the traces from the system in the single molecule fluorescence longevity study, there was a small increase in background and signal noise likely due to the presence of the bead and slightly different molecular configuration.
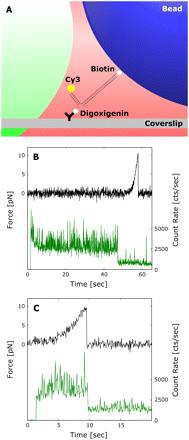
FIGURE 4 Combined measurement using the interlaced modulation technique. (A) Unzipping geometry for a 15-hp dsDNA system. It is attached on one end to a trapped bead via a biotin-streptavidin interaction and immobilized on the other end by meansofadigoxigenin-antibody linkage. The 15-bp region of interest is labeled with a Cy3 fluorophore to confirm the location and timing of the unzipping mechanical event. (B) This system was exposed to OP radiation and its emission monitored until irreversibly photobleaching at ~45 s (green). Upon photobleaching. the dsDNA tether was loaded until rupture at ~10 pN (blue). (C) Simultaneous trace of the force exerted on the dsDNA system (Mue) and the photon emission rate of the Cy3 fluorophore (green). The dsDNA system was loaded at a rate of 1OO nm/s until a mechanical break occurs at ~10 pN (blue). This event is correlated with a simultaneous drop to background in the Cy3 emission rate, corroborating the location of the break. The fluorescence excitation was shuttered for 1.5 s after position acquisition started.
DISCUSSION
Trap stiffness and modulation
A modulated trap can resemble a continuous one if it is modulated at sufficiently high frequency, dependent on the average trapping power. Our results show that a strong trap, formed with 480-mW average trapping power, should be modulated at a frequency of at least 50 kHz, whereas a weaker trap, formed with 60 mW. can be modulated with frequencies as low as 10 kHz while still maintaining trap stiffness (Fig. 2 B). This was further confirmed by fits to a simple exponential model and the resulting linear relationship between the characteristic modulation frequencies and trapping power. For a modulation frequency of 50 kHz, the trap is off for a duration of 10 μs, giving a bead with a diffusivity of 4.36 × 10⁻¹³ m2s-1 enough time to diffuse ~4 nm away from the center of the trap, well within the average signal noise of a relatively weak optical trap. However, for fine measurements with position resolution on the order of 1 nm, such as those required for the resolution of molecular conformational changes and protein folding and unfolding (38.39), the optical trap must be modulated at higher frequencies to minimize diffusional noise. We further validated this technique under a Stokes drag of 10 pN to monitor the effect of modulation on the position bead when it is subject to external loads. Such measurements confirmed that for sufficiently high frequencies the effects of modulation disappear, even when the bead is driven away from the center of the trap (results not shown).
Although these results suggest that the integrity of the trap can be completely recovered at high modulation frequencies, there are practical upper limits on the frequency at which modulation can occur. Acoustic modulation is limited by both the speed of sound in the AOD medium (4.2 mm/μs) and the diameter of the laser (~2.5 mm), which in our system results in a maximum modulation frequency of ~80 kHz. This frequency is appropriate to modulate a trap formed with up to 400 mW of trapping power and characterized with a stiffness up to 0.4 pN/nm. Higher modulation frequencies can be reached by minimizing the diameter of the laser at the AOD location, employing AOD crystal materials that inherently provide higher sound velocities, or implementing electronic modulation techniques such as those used in telecommunications applications or for multiple color fluorescence measurements (40). Though such arrangements will further extend the versatility of this technique, our configuration is suitable for the types of experiments that are commonly approached with optical tweezers force spectroscopy.
Trap-dependent photobleaching reduction
Trap-dependent photobleaching was observed when Cy3 fluorophores were simultaneously irradiated with the fluorescence excitation and trapping beams modulated IP. At the single molecule scale, Cy3 was irreversibly photobleached over an order of magnitude faster than when exposed to the NT condition (Fig. 3). These results are in agreement with previous observations suggesting that the absorption of 1064-nm photons by molecules already in the first excited state can lead to a pathway that accelerates photodestruction (11).
Our simple solution avoids populating these destructive states by allowing excited Cy3 molecules to return to the ground state before exposing the dye of interest to the high infrared photon flux of the trap. This technique significantly reduces destructive photobleaching effects by alternately modulating the fluorescence excitation and optical trapping lasers OP, resulting in a 20-fold longevity improvement over IP radiation (Fig. 3). Despite this improvement, which extends the characteristic longevity of single Cy3 dyes to >30 s, fluorophore longevity remains shorter than that measured in the absence of a trapping laser, suggesting that the lower energy radiation can still cause some photodestruction. Although the mechanism of this additional photobleaching pathway is unknown, it is possible that it may arise from two-photon excitation (41), the detection of which is beyond the sensitivity of our instrument for detecting single molecules. Even though there is preliminary evidence against it (11). this scenario requires further investigation. Nevertheless, by alternately modulating the two beams, the major pathway for trap-dependent photobleaching is effectively eliminated, allowing IOFF to become feasible. Furthermore, this technique can be readily extended to single molecule experiments using other common dyes, such as Alexa 488, green fluorescent protein, and fluorescent resonance energy transfer pairs.
Modulation, optical tweezers, and single molecule fluorescence
We have successfully presented a method for efficiently combining single molecule fluorescence and optical tweezers into a single, functional instrument without sacrificing the capabilities of either technique. The effectiveness of this arrangement was demonstrated by mechanically unzipping a 15-bp dsDNA overhang model system and monitoring the event through the emission of a strategically placed Cy3 dye. This combination of force measurement and fluorescence emission provides solid evidence for the location and nature of the mechanical observations, as fluorescence signatures and force magnitudes differ for other types of breaks (24). In addition, we report an unzipping force of ~10 pN for our 15-bp dsDNA system, which is in agreement with previously reported values for a similar system (8,24).
Though similar results have been presented with an analogous system (8,24), the benefits of our IOFF technique are necessary for combined measurements using common single molecule fluorophores. The most popular of these dyes, including Cy3, are characterized by a high quantum yield and extinction coefficient but are highly susceptible to the trap-induced photobleaching effects that are dramatically reduced by our approach. This result also improves assay development feasibility, a significant hurdle in single molecule research, for the investigation of molecular motor systems that have been independently approached with optical tweezers (42,43), single molecule fluorescence (44-46), or other methods (47.48). Such tools can now be simultaneously combined to elucidate the mechanochemical cycles governing the motion of these systems (35,49,50) and to study real-time force-induced conformational changes (51). In addition, this technique reduces the requirement of a highly efficient trap, allowing experiments involving optical tweezers to take place deep into solution, where they could be coupled with prism-side total internal reflection and other techniques. Furthermore, IOFF can be used to study protein folding and protein-protein and protein-DNA interactions and to monitor the formation of complex structures at the cellular level in response to external force (52).
We have demonstrated the significant reduction of trapdependent photobleaching by alternately modulating fluorescence excitation and optical trapping lasers, showing a 20-fold improvement in Cy3 longevity at the single molecule level. In addition, we have successfully applied the combination of these two techniques to the fluorescence-reported unzipping of a short segment of dsDNA. This application, in which the fluorophore is held directly over the highest photon flux trapping region, suggests the broad versatility of this combined instrument. Such a seamless integration of single molecule fluorescence and optical tweezers force spectroscopy can be implemented through our temporal innovation with other common single molecule dyes in a wide range of molecular configurations for the exploration of the effects of mechanical force in biological systems.
The authors are grateful for financial support provided by the Lemelson Foundation and the Massachusetts Institute of Technology (MIT)/National Institute of General Medical Sciences Biotechnology Training Program (R.R.B.). a Minority Supplement to National Institutes of Health Grant P01HL064858 (J.M.F.). and startup funds from the School of Engineering, the Biological Engineering Division, and the Department of Mechanical Engineering at MIT (M.J.L.).
REFERENCES
1. Ha, T. 2001. Single-molecule fluorescence methods for the study of nucleic acids. CHIT. Opin. Struct. Biol. 11:287-292.
2. Vale, R. D., and R, A. Milligan. 2000. The way things move: Looking under the hood of molecular motor proteins. Science. 288:88-95.
3. Weiss, S. 1999. Fluorescence spectroscopy of single biomolecules. Science. 283:1676-1683.
4. Neuman, K. C., and S. M. Block. 2004. Optical trapping. Rev. Sd. lnstrum. 75:2787-2809.
5. Kapanidis, A. N., and S. Weiss. 2002. Fluorescent probes and bioconjugation chemistries for single-molecule fluorescence analysis of biomolecules. J. Chem. Phys. 117:10953-10964.
6. Wang, Y. X., E. L. Botvinick, Y. H. Zhao, M. W. Berns, S. Usami, R. Y. Tsien, and S. Chien. 2005. Visualizing the mechanical activation of Src. Nature. 434:1040-1045.
7. Weitzman, J. B. 2003. A marriage of techniques. J. Biol. 2:2.
8. Lang, M. J., P. M. Fordyce, and S. M. Block. 2003. Combined optical trapping and single-molecule fluorescence. J. Biol. 2:6.
9. Wallace, M. L, J. E. Molloy, and D. R. Trentham. 2003. Combined singlemolecule force and fluorescence measurements for biology. J. Biol. 2:4.
10. Ishijima, A., and T. Yanagida. 2001. Single molecule nanobioscience. Trends Biochem. Sd. 26:438-144.
11. van Dijk, M. A., L. C. Kapitein, J. van Mameren. C. F. Schmidt, and E. J. G. Peterman. 2004. Combining optical trapping and single-molecule fluorescence spectroscopy: Enhanced photobleaching of fluorophores. J. Phys. Chem. B. 108:6479-6484.
12. Miyata, H., R. Yasuda, and K. Kinosita. 1996. Strength and lifetime of the bond between actin and skeletal muscle alpha-actinin studied with an optical trapping technique. Biochim. Biophys. Ada. 1290:83-88.
13. Pant, K., R. L. Karpel, I. Rouzina, and M. C. Williams. 2005. Salt dependent binding of T4 gene 32 protein to single and double-stranded DNA: Single molecule force spectroscopy measurements. J. MoI. Biol. 349:317-330.
14. Koch, S. J., and M. D. Wang. 2003. Dynamic force spectroscopy of protein-DNA interactions by unzipping DNA. Phys. Rev. Lett. 91:028103. Erratum in Phys. Rev. Lett. 2003. 91:049903.
15. Greenleaf, W. J., M. T. Woodside, E. A. Abbondanzieri, and S. M. Block. 2005. Passive all-optical force clamp for high-resolution laser trapping. Phys. Rev. Lett. 95:208102.
16. Bustamante, C., Z. Bryant. and S. B. Smith. 2003. Ten years of tension: Single-molecule DNA mechanics. Nature. 421:423-427.
17. Smith, D. E., S. J. Tans, S. B. Smith, S. Grimes, D. L. Anderson. and C. Bustamante. 2001. The bacteriophage phi 29 portal motor can package DNA against a large internal force. Nature. 413:748-752.
18. Shaevitz, J. W., E. A. Abbondanzieri, R. Landick, and S. M. Block. 2003. Backtracking by single RNA polymerase molecules observed at near-base-pair resolution. Nature. 426:684-687.
19. Rief, M., R. S. Rock, A. D. Mehta, M. S. Mooseker, R. E. Cheney, and J. A. Spudich. 2000. Myosin-V stepping kinetics: A molecular model for processivity. Proc. Natl. Acad. Sd. USA. 97:9482-9486.
20. Asbury, C. L., A. N. Fehr, and S. M. Block. 2003. Kinesin moves by an asymmetric hand-over-hand mechanism. Science. 302:2130-2134.
21. Pierce, D. W., N. Hom-Booher, and R. D. Vale. 1997. Imaging individual green fluorescent proteins. Nature. 388:338.
22. Ishijima, A., H. Kojima, T. Funatsu, M. Tokunaga, H. Higuchi. H. Tanaka, and T. Yanagida. 1998. Simultaneous observation of individual ATPase and mechanical events by a single myosin molecule during interaction with actin. Cell. 92:161-171.
23. Harada, Y., T. Funatsu, K. Murakami, Y. Nonoyama, A. Ishihama, and T. Yanagida. 1999. Single-molecule imaging of RNA polymerase-DNA interactions in real time. Biophys. J. 76:709-715.
24. Lang, M. J., P. M. Fordyce, A. M. Engh, K. C. Neuman, and S. M. Block. 2004. Simultaneous, coincident optical trapping and single-molecule fluorescence. Nat. Methods. 1:133-139.
25. Panchuk-Voloshina, N., R. P. Haugland, J. Bishop-Stewart, M. K. Bhalgat, P. J. Millard, F. Mao, W. Y. Leung, and R. P. Haugland. 1999. Alexa dyes, a series of new fluorescent dyes that yield exceptionally bright, photostable conjugates. J. Histochem. Cytochem. 47:1179-1188.
26. Lang, M. J., C. L. Asbury, J. W. Shaevitz, and S. M. Block. 2002. An automated two-dimensional optical force clamp for single molecule studies. Biophys. J. 83:491-501.
27. Visscher, K., S. P. Gross, and S. M. Block. 1996. Construction of multiple-beam optical traps with nanometer-resolution position sensing. IEEE J. SeI. Top. Quant. 2:1066-1076.
28. Gittes, F., and C. F. Schmidt. 1998. Back-focal-plane detection efforce and motion in optical traps. Biophys. J. 74:A183.
29. Kapanidis, A. N., N. K. Lee, T. A. Laurence, S. Doose, E. Margeat, and S. Weiss. 2004. Fluorescence-aided molecule sorting: Analysis of structure and interactions by alternating-laser excitation of single molecules. Prtic. Nail. Acad. Sd. USA. 101:8936-8941.
30. Lee, S. H., K. Ladavac, M. Polin. and D. G. Grier. 2005. Observation of flux reversal in a symmetric optical thermal ratchet. Phys. Rev. Lett. 94:110601.
31. Neuman, K. C., E. A. Abbondanzieri, R. Landick, J. Celles, and S. M. Block. 2003. Ubiquitous transcriptional pausing is independent of RNA polymerase backtracking. Cell. 115:437-47.
32. Ha, T., I. Rasnik, W. Cheng, H. P. Babcock, G. H. Gauss, T. M. Lohman, and S. Chu. 2002. Initiation and re-initiation of DNA unwinding by the Escherichia coli Rep helicase. Nature. 419:638-641.
33. Hoogenboom, J. P., E. M. van DiJk. J. Hernando, N. F. van Hulst, and M. F. Garcia-Parajo. 2005. Power-law-distributed dark states are the main pathway for photobleaching of single organic molecules. Phys. Rev. Lett. 95:097401.
34. Curtis, J. E., B. A. Koss. and D. G. Grier. 2002. Dynamic holographic optical tweezers. Opt. Commun. 207:169-175.
35. Tokunaga, M., K. Kitamura, K. Saito, A. H. !wane, and T. Yanagida. 1997. Single molecule imaging of fluorophores and enzymatic reactions achieved by objective-type total internal reflection fluorescence microscopy. Biochem. Biophys. Res. Commun. 235:47-53.
36. Wennmalm, S., and R. Rigler. 1999. On death numbers and survival times of single dye molecules. J. Phys. Chem. B. 103:2516-2519.
37. Liphardt, J., B. Onoa, S. B. Smith. I. Tinoco. and C. Bustamante. 2001. Reversible unfolding of single RNA molecules by mechanical force. Science. 292:733-737.
38. Kellermayer, M. S. Z., S. B. Smith, H. L. Granzier, and C. Bustamante. 1997. Folding-unfolding transitions in single titin molecules characterized with laser tweezers. Science. 276:1112-1116.
39. Rief, M., M. Gautel, F. Oesterhelt, J. M. Fernandez, and H. E. Gaub. 1997. Reversible unfolding of individual titin immunoglobulin domains by AFM. Science. 276:1109-1112.
40. Kapanidis, A. N., T. A. Laurence, N. K. Lee, E. Margeat, X. X. Kong, and S. Weiss. 2005. Alternating-laser excitation of single molecules. Ace. Chem. Res. 38:523-533.
41. So, P. T. C., C. Y. Dong, B. R. Masters, and K. M. Berland. 2000. Two-photon excitation fluorescence microscopy. Annu. Rev. Biomed. Eng. 2:399-429.
42. Nishiyama, M.. H. Higuchi, and T. Yanagida. 2002. Chemomechanical coupling of the forward and backward steps of single kinesin molecules. Nat. Cell Biol. 4:790-797.
43. Veigel, C., S. Schmitz. F. Wang, and J. R. Sellers. 2005. Loaddependent kinetics of myosin-V can explain its high processivity. Nat. Ceil BM. 7:861-869.
44. Warshaw, D. M., G. G. Kennedy, S. S. Work, E. B. Krementsova, S. Beck, and K. M. Trybus. 2005. Differential labeling of myosin V heads with quantum dots allows direct visualization of hand-over-hand processivity. Biophys. J. 88:L30-L32.
45. Yildiz, A., H. Park, D. Safer, Z. H. Yang, L. Q. Chen. P. R. Selvin, and H. L. Sweeney. 2004. Myosin VI steps via a hand-over-hand mechanism with its lever arm undergoing fluctuations when attached to actin. J. Biol. Chem. 279:37223-37226.
46. Gordon, M. P., T. Ha, and P. R. Selvin. 2004. Single-molecule highresolution imaging with photobleaching. Proc. Natl. Acad. Sci. USA. 101:6462-6465.
47. Reck-Peterson, S. L., and R. D. Vale. 2004. Molecular dissection of the roles of nucleotide binding and hydrolysis in dynein's AAA domains in Saccharomyces cerevisiae. Proc. Natl. Acad. Sci. USA. 101;1491-1495.
48. Tolic-Norrelykke, S. F., A. M. Engh, R. Landick, and J. Gelles. 2004. Diversity in the rates of transcript elongation by single RNA polymerase molecules. J. BM. Chem. 279;3292-3299.
49. Schnitzer, M. J., and S. M. Block. 1995. Statistical kinetics of processive enzymes. Cold Spring Harb. Symp. Quant. Biol. 60;793-802.
50. Block, S. M., C. L. Asbury, J. W. Shaevitz, and M. J. Lang. 2003. Probing the kinesin reaction cycle with a 2D optical force clamp. Proc. Natl. Acad. Sci. USA. 100;2351-2356.
51. Chigaev, A., T. Buranda, D. C. Dwyer, E. R. Prossnitz. and L. A. Sklar. 2003. FRET detection of cellular alpha 4-integrin conformational activation. Biophys. J. 85;3951-3962.
52. Galbraith, C. G., K. M. Yamada. and M. P. Sheetz. 2002. The relationship between force and focal complex development. J. Cell Biol. 159;695-705.
| |
