| |
You are here: MIT OpenLabWare » Optical Trapping
» Timeline
Timeline
The timeline can be sorted by date or path. A path is a particular research avenue, subsidiary to the ultimate goal.
To view the experiments in each subsection, click on the "+" next to that subsection. You can expand and collapse the
sections as you see fit.
- Experiment
- 1. Bead position vs. time, varying frequency and duty cycle. (07/10/2005)
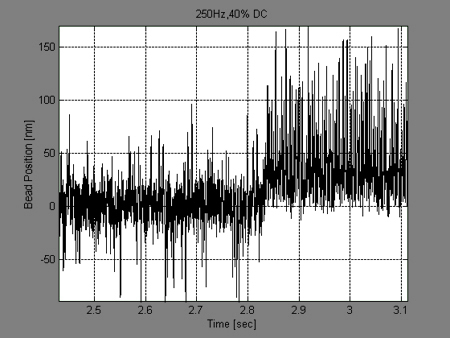
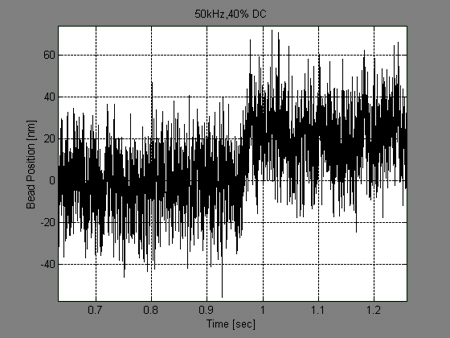
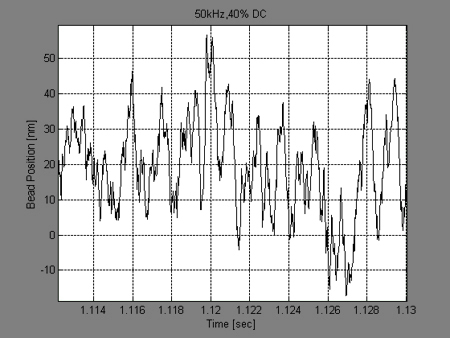
Purpose/Intro: Measure bead position vs. time at 250 Hz, 40% duty cycle and at 50 kHz, 40% duty cycle.
Results: At 250 Hz and 40% DC the bead position varies between 0 nanometers (nm) and 180 nm. At 50 kHz and 40% DC, the bead position varies less, between -10 nm and 50 nm. The higher frequency traps the bead better than the lower frequency.
Image: Figure
Image: Figure
Image: Figure
Image: Figure
Notebook page
- 2. Modulation frequency effect on bead position. (07/12/2005)
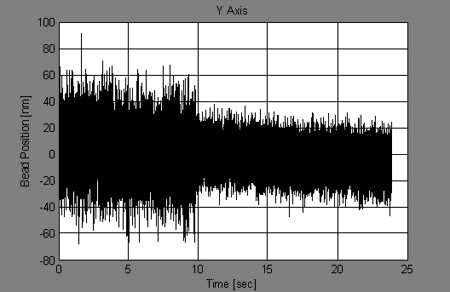
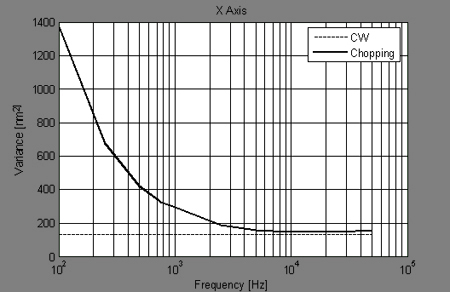
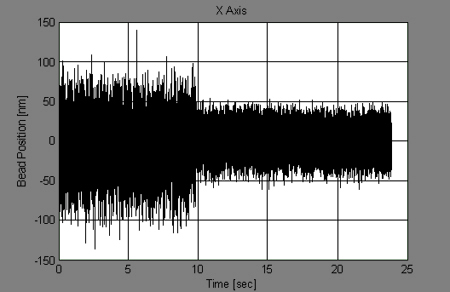
Purpose/Intro: Measure bead position vs. time on the x axis and the y axis at 100 Hz and 1 kHz to see what effects frequency has on the trap.
Results: The bead was more stable at a frequency of 1 kHz on both axes. The variance in bead position decreases exponentially with increasing frequency.
Image: Figure
Image: Figure
Image: Figure
Image: Figure
Notebook page
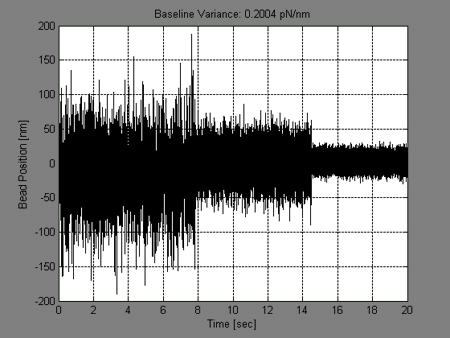
- 3. Bead position and trap stiffness (07/13/2005)
Purpose/Intro:
1. Measure bead position vs. time at 100 Hz, 1 kHz, and 10 kHz.
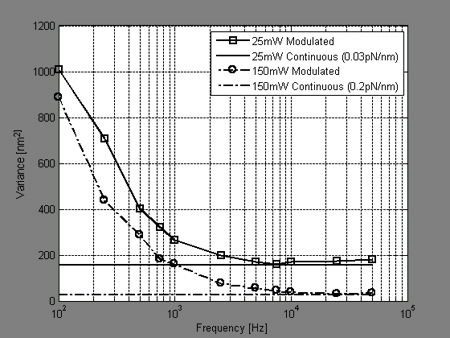
2. Measure bead variance vs. frequency at trap stiffness of 0.201 pN/nm for a modulated laser and for a continuous laser. Repeat experiment with a trap stiffness of 0.031 pN/nm.
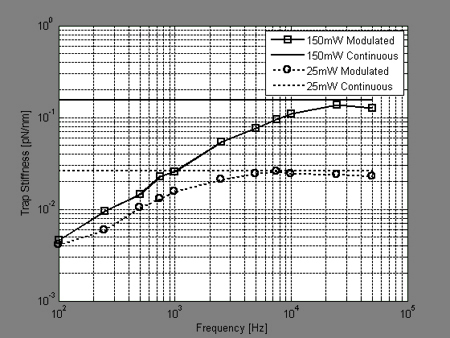
3. Measure trap stiffness vs. frequency at 150 mW modulated and continuous lasers and 25 mW modulated and continuous lasers.
4. Measure trap stiffness vs. frequency at 150 mW and 25 mW.
Results:
1. Bead position is more stable at higher frequencies.
2. There is less variance at the higher trap stiffness of 0.201 pN/nm. Variance decreases with increasing frequency.
3. Trap stiffness increases with frequency and is higher for a power of 150 mW than for a power of 25 mW.
4. Same results as above.
Image: Figure
Image: Figure
Image: Figure
Image: Figure
Notebook page
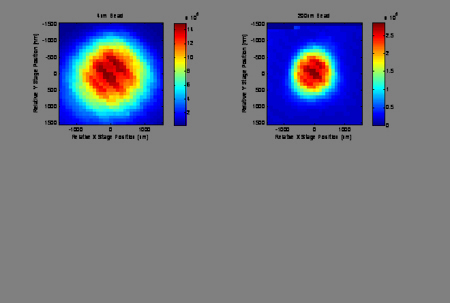
- 4. Pinhole experiment (07/15/2005)
Purpose/Intro: Determine the amount of space on a microscope slide that corresponds to the pinhole through which light coming from a bead can be detected. The bead is covered in a dye, and the light coming from it is the light that fluoresces from the dye.
Results: A 4 micrometer bead can be detected on a space of approximately 2,000 nanometers. A 200 nanometer bead can be detected on a space of approximately 1,000 nanometers.
Image: Figure
Notebook page
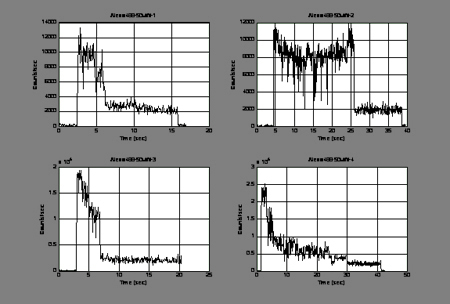
- 5. Alexa488 dye decay (07/15/2005)
Purpose/Intro: Measure decay of Alexa488 dye over time when trap laser is imposed on it.
Results: The fluorescence decays gradually, but when the trap laser is turned on, it decays immediately.
Image: Figure
Notebook page
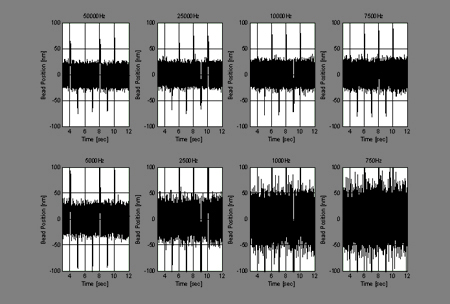
- 6. Bead position vs time at various frequencies. (07/19/2005)
Purpose/Intro: Measure bead position vs. time are various frequencies (50,000 Hz, 25,000 Hz, 10,000 Hz, 7,500 Hz, 5,000 Hz, 2,500 Hz, 1,000 Hz, 750 Hz)
Results: The bead position varies the least at higher frequencies. The highest frequency tested (50,000 Hz) showed the least variation while the lowest (750 Hz) showed the greatest variation.
Image: Figure
Notebook page
- 7. Trap stiffness vs. laser power (07/20/2005)
Purpose/Intro: Measure trap stiffness as a function of laser power using the variance method.
Results: Trap stiffness increases with increasing power.
The stiffness of the trap increases linearly with power. The lines labeled AOD X and Y and QPD X and Y represent different methods of measuring bead position and hence trap stiffness.
Image: Figure
Notebook page
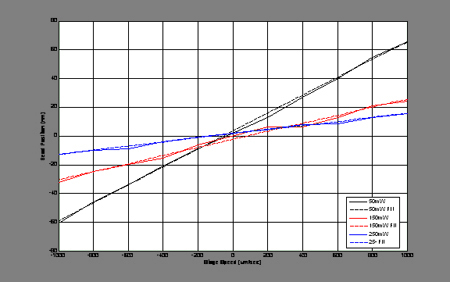
- 8. Bead position vs. stage speed (07/20/2005)
Purpose/Intro: Measure bead position as a function of stage speed at different powers (50 mW, 150 mW, 250 mW). The higher the stage speed, the more force applied to the bead, which causes it to move further.
Results: The bead moves away from "zero" position, or the center of the trap, as the stage speed increases. The laser at the highest power (250 mW) holds the bead more steadily, so it doesn't move much from "zero" position.
Image: Figure
Notebook page
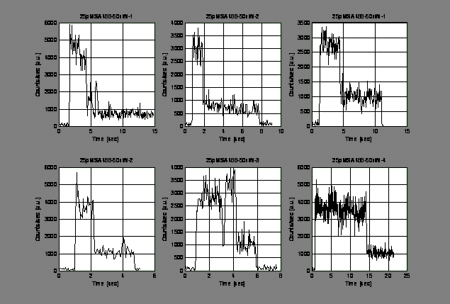
- 9. pMSA488 dye decay (07/20/2005)
Purpose/Intro: Measure decay of pMSA488 dye over time when trap laser is turned on.
Results: The fluorescence decays almost immediately when the trap laser is turned on.
Image: Figure
Notebook page
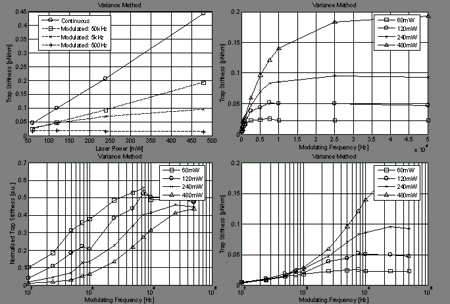
- 10. Trap stiffness, laser power, modulation frequency (07/29/2005)
Purpose/Intro:
1. Measure trap stiffness vs. laser power at varying modulating frequencies (500 Hz, 5kHz, 50kHz).
2. Measure trap stiffness vs. modulating frequency at varying powers (60, 120, 240, and 480 mW).
Results: Trap stiffness increases with increasing power and with increasing frequency.
Image: Figure
Notebook page
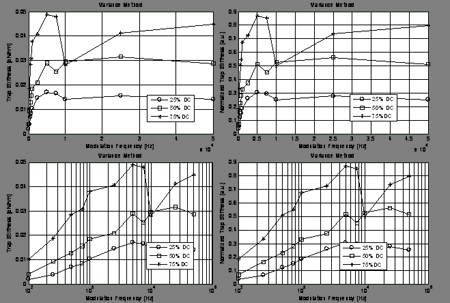
- 11. Duty cycle effects on trap integrity (08/02/2005)
Purpose/Intro: Measure the effect of duty cycles on trap integrity.
Results: A 75% duty cycle appears to provide the highest trap stiffness.
Image: Figure
Notebook page
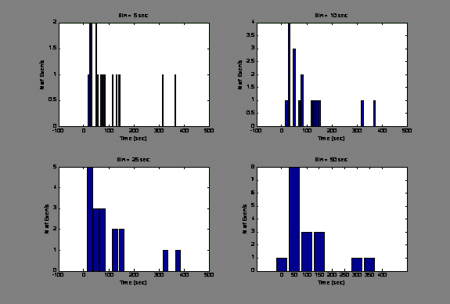
- 12. Alexa488 dye fluorescence (08/02/2005)
Purpose/Intro: Measure fluorescence of alexa488 dye over time with no trapping laser.
Results: Most events were counted at around 20 seconds. The events counted decrease with time.
On the x axis, each bar (bin) represents a span of time. The height of the bar on the y axis represents the number of alexa488 dye molecules that fluoresced for that given span of time. These graphs show that most fluoresced for approximately 20 seconds.
Image: Figure
Notebook page
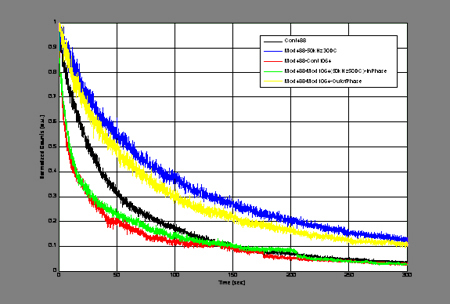
- 13. Alexa488 dye decay under various conditions (08/02/2005)
Purpose/Intro: Measure fluorescence decay of Alexa488 dye over time under the following conditions:
1. Continuous excitation laser (488 nm).
2. Modulated excitation laser (488 nm) at 50 kHz, 30% duty cycle.
3. Modulated 488 nm and continuous trapping laser (1064 nm).
4. Modulated 488 nm and modulated 1064 nm (50 kHz, 50% DC)- In Phase
5. Modulated 488 nm and modulated 1064 nm (50kHz, 50% DC)- Out of Phase
Results: In Phase and continuous 1064 showed the greatest decay. Surprisingly, there was faster decay with continuous 488 than with the Out of Phase condition.
Image: Figure
Notebook page
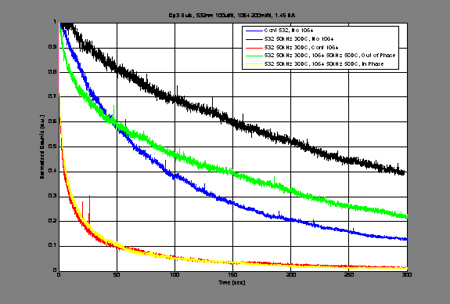
- 14. Cy3 fluorescence under various conditions (08/08/2005)
Purpose/Intro: Measure Cy3 fluorescence over time under the following conditions:
1. Continuous 532 nm excitation laser without the trapping 1064 nm laser.
2.532 modulated at 50 kHz, 30% DC, No 1064.
3. 532 at 50 kHz, 30% DC, continuous 1064.
4. 532 at 50 kHz 30% DC, 1064 at 50 kHz 50 DC, Out of Phase (OP)
5. 532 at 50 kHz 30% DC, 1064 at 50 kHz 50 DC, In Phase (IP)
Results:
1. The conditions with continuous 1064 and In Phase lasers showed the fastest decay.
2. The condition with no 1064 and modulated 532 showed the slowest decay.
3. OP condition and "continuous 532, no 1064" showed similar decay. Decay under OP condition was slower.
Image: Figure
Notebook page
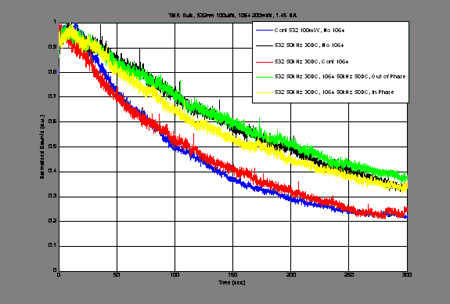
- 15. TMR fluorescence under various conditions (08/08/2005)
Purpose/Intro: Observe fluorescence of TMR over time under the following conditions:
1. Continuous 532, No 1064.
2. 532 50 kHz 30 DC, No 1064.
3. 532 50 kHz 30 DC, Cont 1064.
4. 532 50 kHz 30 DC, 1064 50 kHz 50 DC, Out of Phase (OP).
5. 532 50 kHz 30 DC, 1064 50 kHz 50 DC, In Phase (IP).
Results:
1. No 1064, OP, and IP conditions showed similar decay.
2. Slow, similar decays for Continuous 532, No 1064 and 532 (50 kHz 30 DC), Continuous 1064 conditions.
Image: Figure
Notebook page
- 16. Cy3 fluorescence under excitation and trapping laser (08/16/2005)
Purpose/Intro: Measure fluorescence events over time for Cy3 dye. Excitation laser is at 50 kHz, 30 DC. Trap laser is at 50 kHz, 50 DC. The conditions are: No Trap, In Phase, Out of Phase.
Results:
1. For no trapping laser condition, most events are recorded after about 50 seconds. The longest lasting molecules fluoresce for about 400 seconds.
2. For OP, the longest lasting fluoresce for 150 seconds.
3. For IP, the longest lasting fluoresce for 6 seconds.
4. Clearly, the out of phase condition works much better than the In Phase condition.
Image: Figure
Notebook page
- 17. Cy3 fluorescence, In Phase (08/30/2005)
Purpose/Intro: Measure fluorescence of Cy3 over time and after the In Phase trapping laser is turned on.
Results: Cy3 fluorescence decays gradually but then decays immediately at about 12 seconds, when the trapping laser is turned on.
Image: Figure
Notebook page
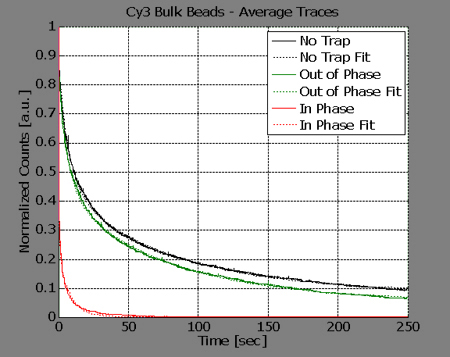
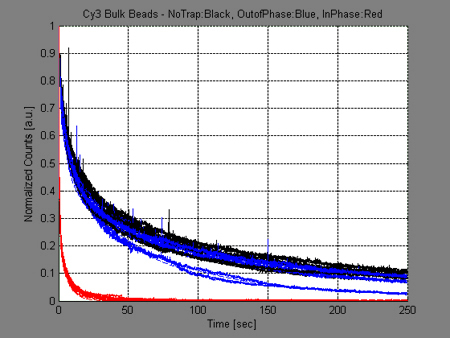
- 18. Cy3 under IP, OP, and no trap conditions (08/31/2005)
Purpose/Intro: Repeat Cy3 bulk experiments with no trap, OP, and IP conditions.
Results: The no trap condition showed the slowest decay, followed by the OP condition, and the IP condition.
Image: Figure
Image: Figure
Image: Figure
Notebook page
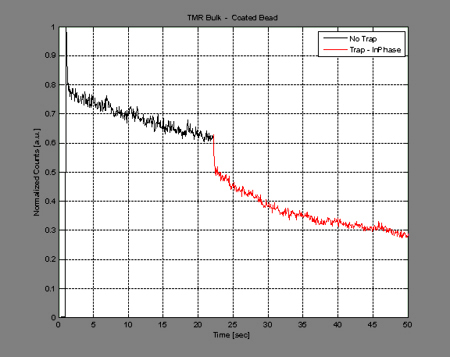
- 19. TMR dye bulk fluorescence (09/01/2005)
Purpose/Intro: Perform bulk fluorescence experiments for TMR dye.
Results: TMR decayed slowly for about 22 seconds. At that time, the trapping laser was turned on, causing a small sharp decrease. After that small decay, the fluorescence continued decaying slowly.
1. TMR not greatly affected by the trap.
2. In fact, TMR IP is better than Cy3 with no trap.
Image: Figure
Notebook page
- 20. Alexa555 decay (09/06/2005)
Purpose/Intro: Measure fluorescence decay of Alexa555 coated bead over time and when a trapping laser is turned on.
Results: Alexa555 decays gradually, but when the trapping laser is turned on it decays rapidly.
Image: Figure
Notebook page
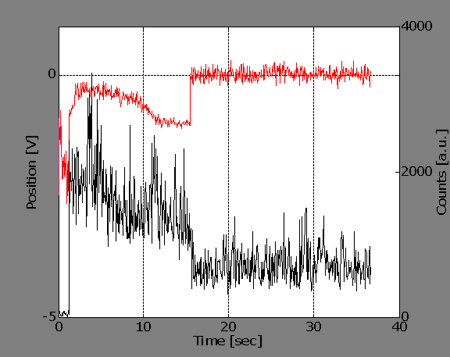
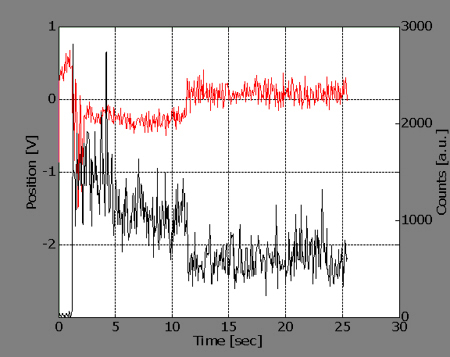
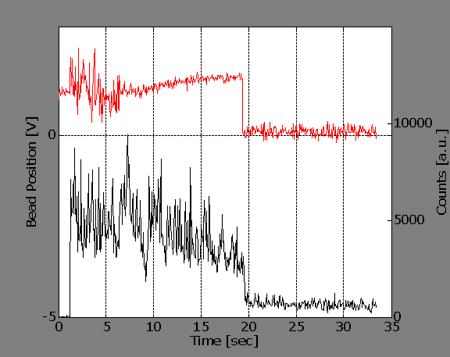
- 21. Combined measurement (10/20/2005)
Purpose/Intro: Determine if the trapping laser can detect DNA unzipping at the same time as the excitation laser detects a drop in emission from the Cy3 molecule.
Results: The charts show a peak in force measurements at the same time as a drop in fluorescence from the Cy3. These results suggest that detection using both the trapping laser and the fluorescence laser can be done simultaneously.
In the graphs below the red line represents the force measurement taken while the black line represents the fluorescence measurement. There is an increase in force at the same time that there is a drop in fluorescence.
Image: Figure
Image: Figure
Image: Figure
Image: Figure
Notebook page
| |
